Project development
Erat, sed diam voluptua. Consetetur sadi pscing elitr, sed diam nonumy eirmod Erat, sed diam voluptua. At vero eos et accusam et justo.
Project developmentErat, sed diam voluptua. Consetetur sadi pscing elitr, sed diam nonumy eirmod Erat, sed diam voluptua. At vero eos et accusam et justo.
Turtle research
Sea turtles are considered to have originated about 150 million years ago and yet they continue their race in the sea unlike their contemporary animals on land namely the dinosaurs which became extinct. This indicates that these innocent lung breadthing poikilotherms have had a long evolutionary history and their physiological conditions have helped them to tide over the catastrophic changes during the long period of evolution. It is interesting to study the physiological changes which are unique in this animal particularly with refrence to the blood chemistry because of its unique parameters unlike to any other reptiles. Studies in the haematology of lesser vertebrates are known, yet in turtle such studies have not been attempted except in a few species.
The turtle was placed ventral side up and held lightly. A sterilized needle 18ga attached to a 5ml syringe was introduced towards a point below the medial junction of the humeral and pectoral shields on the plastron according to the method described by Stephens and Creekmore (1983) (Fig.2). The most effective method was to insert the needle fully then apply gentle suction as the needle was slowly withdrawn. When blood began to fill the syringe the needle was collected. The suction was then released and the needle rapidly withdrawn. The blood collected was immediately transferred to the bottle containing EDTA or double oxalate.
For the investigations of red cell, white cell counts, packed cell volume and differential count the blood collected from the turtle was collected in double oxalate anticoagulant. For the investigations of haemoglobin and T-lymphocytes the blood was collectedwith Edta (Ethylene Diamine Tetra Acetic Acid [CH2N(CH2COOH)2]2) as anticoagulant.
Nine animals having carapace length range 19.0 to 71.3cm and breadth range from 18.5 to 63.8cm and the plastron length range 13.5 50 50.0cm and breadth range 15.0 to 50.8cm were used for the present study (Table I).
The red cell count was made with Neubauer counting chamber.The red cell count range 42x104 to 62x104/mm3 with a mean of 36.9 x10⁴/mm3 for animals ranging between 19.0 to 71.2cm. There was a decrease in the red cellcount as the length or size of the animals increased (Table II, Fig.6). The animal with carapace length 19.0cm, red cell count was 62x104/mm3 and as the growth increase to a length of 71.2cm, the red cell count was decreased to 42x104/mm3. The red cells were oval in shape and rarely round cells were also seen. It had a homogeneous cytoplasm completely surrounding a centrally located oval nucleus(Plate I). The cytoplasm was stained lightly and the nucleus was stained deeply with Leishman´s stain. As only nine animals were used for the present study the increase in the length and width of erythrocytes were not clearly seen. The length of erythrocytes ranged between 9.1 to 16.3cm, with a mean of 12.7cm,(Table II).
The white cell count was also made with Neubauer counting chamber. The white cell count ranged from 11.3x10³ to 16x103/mm, with a mean of 13.9x10³/mm3 for animals ranging from 19.0 to 71.2cm. The white cell count also showed a decrease as length or size of the animal increased (Table III, Fig.7). The animal having carapace length of 19.0cm, WCC as 16x103/mm3 and as the length increased to 71.2cm the cell count decreased to 11.3x10³/mm3.
The packed cell volume was determined by centrifuging blood in a PCV tube for about half an hour. The packed cell volume ranged from 32 to 38% with a mean of 35.6% in animals having carapace length ranging from 19.0 to 71.2cm. The animal having the carapace length 19.0 cm had a PCV of 32% and the animal having the carapace length 71.2 cm had a PCV of 38%. There was an increase in the packed cell volume as the size of the animal increased (Table III, Fig.8). The haemogoblin content found to be increasing as size of the animal increased. In the animals with carapace length of 29.0 and 21.8cm, haemoglobin content was found to be 19.0 and 21.8cm, haemoglobin content was found tobe 13.8% and 14.1g% respectively. However, the animal with a carapace length of 71.2cm, haemoglobin was 17.9g%. The haemoglobin content ranged from 13.8to 17.9% with a mean of 15.9g% for animals ranging from 19.0 to 71.2cm (Table III, Fig.8).
The differential count was made from the smear prepared with Leishman´s stain. The most numerous of the white cells were the lymphocytes. The cells were spherical or oval in shape(Plate I). The nucleus is irregularly shaped and varies in size from filling the cell to one third the size of the cell. A large lymhocyte can be observed (Plate II). Lymphocyte population was found to be more or less uniform irrespective of size of the animal with a range of 68 to, 93% (Mean 76%) for the length of the animals ranging between 19.0 to 71.2cm. The lymphocyte size ranged between 7.6 to 10.0,um with a mean of 8.8,um 9Table Iv, Fig.9 and 10).
The basophil of L.olivacea is a small spherical cell. The spherical granules are strongly basophilic, entirely filling the cell and completely masking the nucleus which when distinguishable is centrally located occupying almost one half of the cell(Plate II). The granules stain light red. The basophil count also did not show any increasing or decreasing trend as the size of the animal increased. The basophil count ranged from 1 to 20% with a mean of 10%. The basophil size ranged between 10.4 to 16.4,um with a mean of 12.9,um for animals ranged between 19.0 to 71.2cm (Table IV, Fig.9 and 10).
The eosinophil is a large round cell with peripherally located nucleus. The nucleus is bell shaped. The cytoplasm is completely filled with coarse spherical granules (Plate I). The nucleus is weekly basophilic and the granules strongly eosinophilic. The eosinophil count showed a decrease in number as the size of the animal increased. The animal with a carapace length of 19.0cm had an eosinophil count of 11% and for 71.2cm carapace length the count was 4%. The eosinophil count ranged from 4 to 11% with a mean of 7%. The cell size ranged from 12.0 to 20.4,um with a mean of 15.7,um (Table IV, Fig.9 and 10).
Another distinct type of granulated white cell observed in the circulating blood of L.olivacea is a neutrophil. The cell is spherical and almost equal in size to that of the eosinophil (Plate.I). The nucleus is peripheral and in the form of horse shoe shaped. The nucleus is strongly basophilic and the granules are eosinophilic. The cytoplasm is fillied with fine granules and the nucleus is more distinctly visible than in eosinophils. There appears to be an increase in the number of neutrophils as the turtle grows and increases in size. The neutrophil count ranged from 1 to 14% with a mean of 7%. The animal with length of 19.0cm, had a neutrophil count of 1% and the one with 62.5cm had a count of 14%. The cell size ranged from 9.8 to 20.0,um with a mean of 14.6,um (Table IV, fig.9 and 10).
Comparing the sizes of the different cell types the red cells were the largest with a mean length of 21.6,um and width 12.7,um. The lymphocytes were the smallest type with a mean size of 8.8,um. Comparing the cell size of basophil, eosinophil and neutrophil, the eosinophils were larger with a mean size of 15.7,um followed by the neutrophil with a mean size of 14.6, um and 12.9,um respectively (Fig.10.).
The study on T- lymphocytes was also made in L. Olivacea. Not much work has been done regarding the T-lymphocyte in turtles. The T-lymphocyte percentage ranged from 58 to 80 with a mean of 68% in animals ranging with less than 3 spleen RBC constituted 75 to 80% of the total T-lymphocytes than the lymphocytes with more than 2 sheep RBC which constituted only about 20 to 25% of the total T-lymphocytes (Fig.11), (Plate, III).
The mean and standard deviation of all the cell types and PCV and haemoglobin is shown in Fig.12.
Trace metal concentration in the various tissues of the sea turtle Lepidochelys olivacea was studied. However, very little work has been done on trace metals in sea turtles. The concentration of iron was high in serum being 4.12 ppm and low 0.88 ppm in brain tissues. Kidney and heart tissues did not show much difference, with a concentration of 1.91 and 1.72ppm respectively. Spleen and liver tissues had a concentration of 3.21 and 2.16ppm respectively. However not much variation in the zinc concentration in different tissues were noticed, Kidney0.83ppm and brain 0.12ppm. Likewise manganese in spleen tissues, o.46ppm and in serum 0.12ppm were recorded. Copper too did not show variation, the range being 0.13 to 0.68ppm in the different tissues with brain tissues 0.13ppm and kidney 0.680ppm. Generally all the tissues comparatively had a high concentration of iron than zinc, manganese or copper
(Table VI, Fig.13).
Serum protein separation was done by electrophoresis compared with human serum protein which had r,B, L2,L1 and albumin fraction turtle serum protein shoed only r, B and albumin fractions (Plate III).
Table 1. The relationship between length and breadth of carapace and plastron of Lepidochelyolivacea.
CARAPACE PLASTRON
|
No |
Length (cm) |
Breath (cm) |
Length (cm) |
Breath (cm) |
|
1. |
19.0 |
18.5 |
13.5 |
15.0 |
|
2. |
21.8 |
21.4 |
16.4 |
17.8 |
|
3. |
23.8 |
23.0 |
17.2 |
18.1 |
|
4. |
28.0 |
27.1 |
19.7 |
21.1 |
|
5. |
30.0 |
31.2 |
22.0 |
24.7 |
|
6. |
34.2 |
33.8 |
25.2 |
26.0 |
|
7. |
59.2 |
55.0 |
40.0 |
41.1 |
|
8. |
62.5 |
58.2 |
45.8 |
43.3 |
|
9. |
71.2 |
63.8 |
50.0 |
50.8 |
TABLLE II: Red cell count of Lepidochelys olivacea in relation to age.
CARAPACE RED CELL COUNT LENGTH AND WIDTH
No. ERYTHROCYTES um LENGTH Cm X10 /mm
1. 19.0 62 Length
2. 21.8 56
3. 23.8 54 21.6 + 2.4
------------------
4. 28.0 47 18.0 - 25.2
5. 30.0 47
6. 34.2 45 Width
7. 59.3 42.
8. 62.5 44 12.7 + 2.3
----------------------
9. 71.2 42 9.1 - 16.3
X + SD 38.8 + 18.8 48.8 + 6.6
----------- --------------- -----------------
Range 19.0 - 71.2 42 - 62
TABLE III: White cell count, packed cell volume and Hemoglobin of Lepidchelys olivacea in relation to age
No. CARAPACE WHITE CELL PACKED CELL HAEMOGLOBIN
LENGTH Cm COUNT VOLUME% g%
x103 /mm3
1. 19.0 16.0 32 13.8
2. 21.8 16.3 33 14.1
3. 23.8 14.5 35 14.9
4. 28.0 13.8 36 15.0
5. 30.0 13.6 36 15.9
6. 34.2 14.3 37 16.8
7. 59.2 12.7 37 17.7
8. 62.5 13.0 36 17.1
9. 71.2 11.3 38 17.9
X + SD 38.8 + 18.8 13.9 + 1.5 35.6 + 1.9 15.9+ 1.4
--------------- --------------------- -------------- ---------------- -------------
Range 19.0 - 71.2 11.3 - 16.3 32 -38 13.8- 17.9
TABLE IV: Differential count of white cells in Lepidochelys olivacea of different age group
No./100 white cells
Different CARAPACE LENGTH (Cm) X + SD Cellsize
WHITE --------------------------------------------------------- RANGE OF um
CELLS 19.0 21.8 23.8 28.0 30.0 34.2 59.2 62.5 71.2 DIFFERENT
WHITE CELLS
LYMPHPCYTE 85 93 83 71 69 68 76 70 68 76 + 8 8.8 + 0.7
--------------- ---------------------
68 - 93 7.6 - 10.0
BASOPHIL 3 1 5 12 20 18 8 10 16 10 + 6 12.9 + 1.8
---------------- ---------------------
1 - 20 10.4 - 16.4
EOSINOPHIL 11 5 9 11 6 6 5 6 4 7 + 2 15.7 + 2.7
------------------ ------------------------
4 - 11 12.0 - 20.4
NEUTROPHIL 1 1 3 6 5 8 11 14 12 7 + 4 14.6 + 3.1
--------------------- -----------------------
1 - 14 9.8 - 20.0
THROMBOCYTE 34 50 62 32 70 20 42 47 58 46 + 15
---------------------- --------
20 - 70
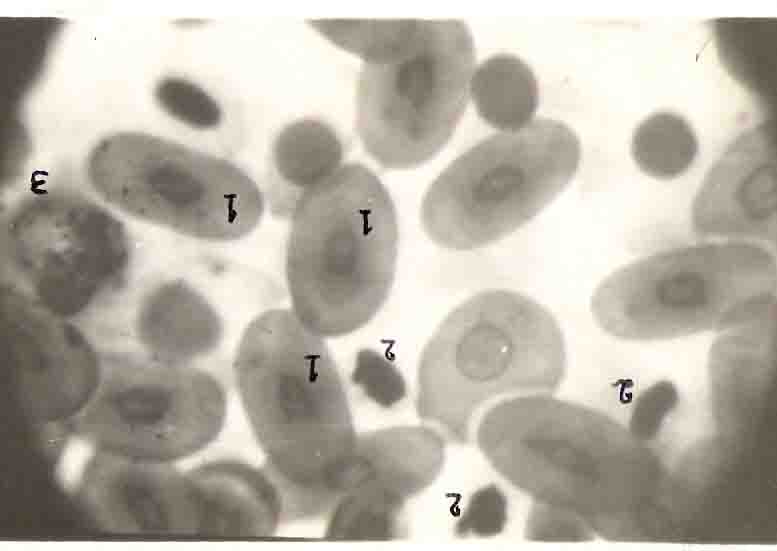
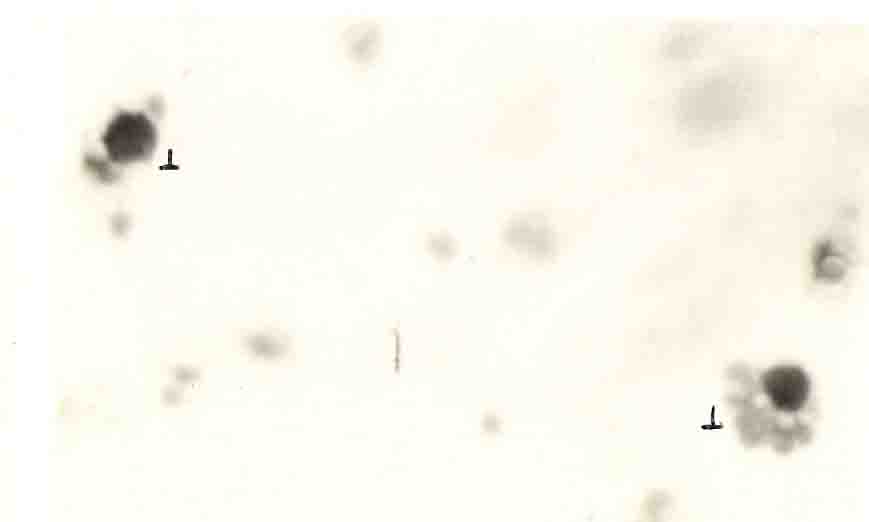
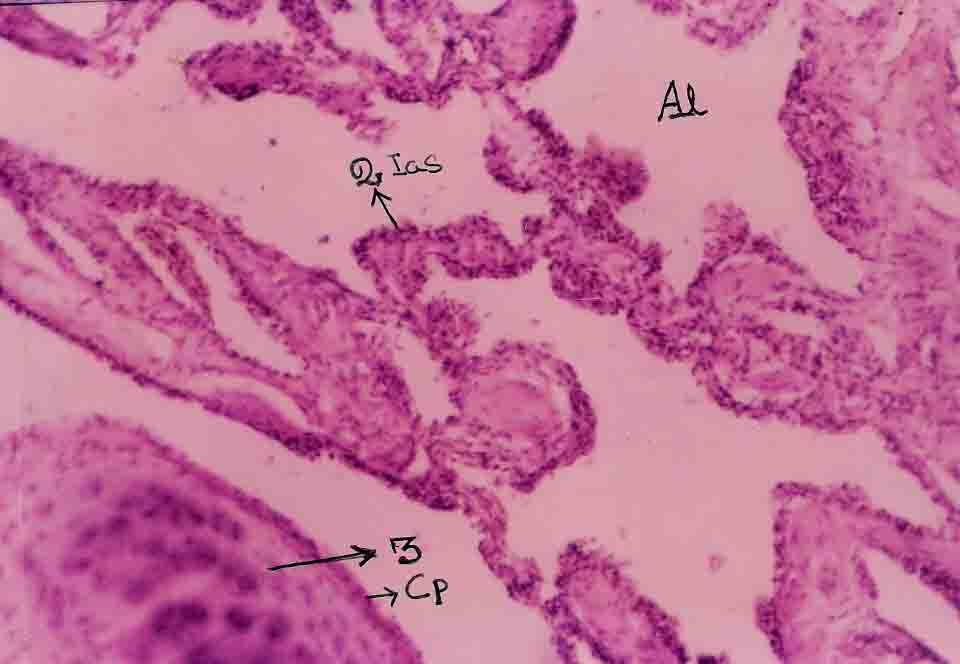
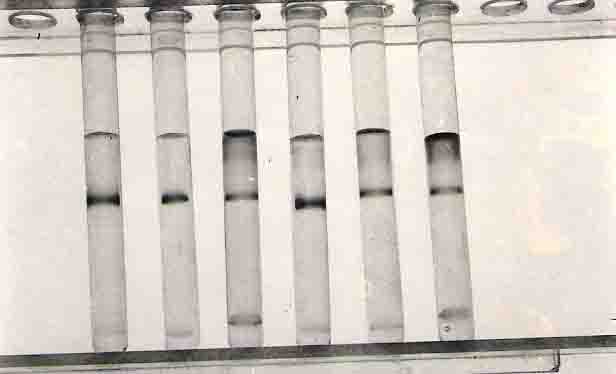
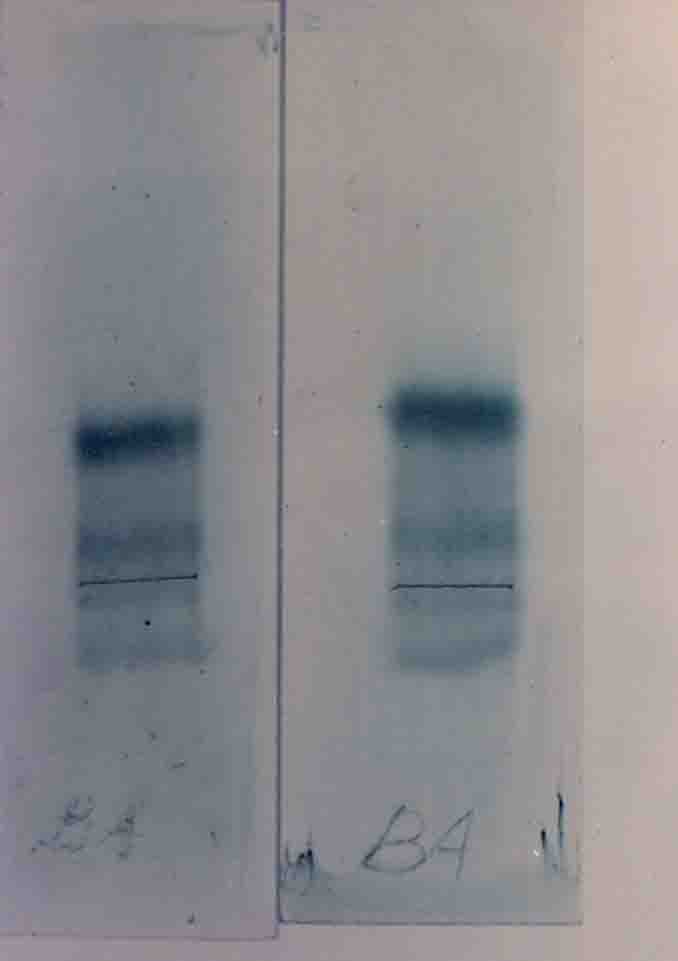
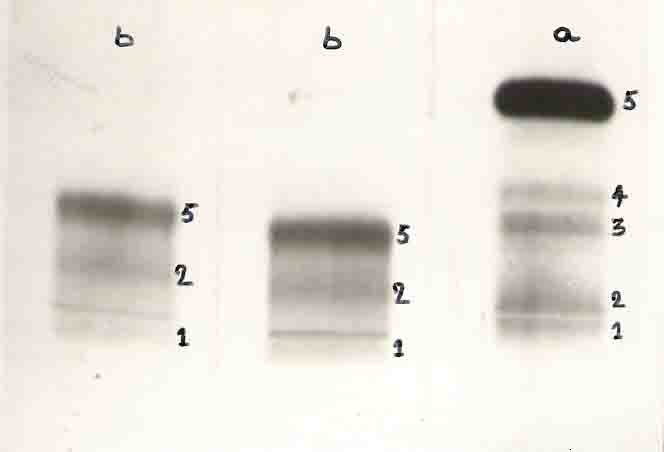
TABLE V : T-Lymphocytes of Lepidochelys olivacea of different age group.
LYPHOCYTES LYMPHOCYTES LYNPHOCYTES TOTAL
NO. CARAPACE WITHOUT WITH LESS WITH MORE T-LYMPHOCYTES
LENGTH Cm SRBC THAN 3 SRBC THAN SRBC %
(PLAIN)% % %
1. 19.0 29.0 58 13 71
2. 21.8 32 53 15 68
3. 23.8 32 56 12 68
4. 28.0 29 49 22 71
5. 30.0 39 43 18 61
6. 34.2 42 45 13 58
7. 59.2 30 52 18 80
8. 62.5 31 53 16 69
9. 71.2 36 45 19 64
38.8 + 18.8 68 + 6
-------------------- ------------
19.0 - 71.2 58 - 80
TABLE VI: Trace metals concentration in various tissues of Lepidochelys olivacea
TRACE METALS SERUM BRAIN SPLEEN KIDNEY HEART LIVER
Iron 4.12 0.88 3.21 1.91 1.72 2.16
Zinc 0.20 0.12 0.53 0.83 0.72 0.62
Manganese 0.12 0.26 0.46 0.42 0.42 0.37
Copper 0.40 0.13 0.49 0.68 0.35 0.58
The haematology of sea turtle Lepidochelys olivacea was studied on nine turtles of different age. Their carapace length ranged between 19.0cm to 71.2cm and breadth ranged between 18.5 to 63.8cm. Their plastron length ranged between 13.5 to 50.0cm and breadth 15.0 50 50.8 cm.
The red cell count ranged between 42x103/mm to 62 x103/mm with a mean of 36.9x10³/mm. The red cell count was found to be decreasing as the carapace length increased. The white cell count ranged between 11.3x10³ to 16x103/mm with a mean of 13.9x10³/mm. The white cell count decreased with an increase in carapace length. The packed cell volume ranged between 32% to 38% with a mean of 35.6%. There was an increase in the packed cell volume as the carapace length increased.
The hemoglobin content was found to be increasing with an increase in carapace length. The hemoglobin content ranged between 13.8% to 17.9% with a mean of 15.9g%.
The lymphocyte count ranged between 68% to 93% with a mean of 76%. The most numerous of the white cells were the lymphocytes. The lymphocyte size ranged between 7.6 to 10.0um with a mean of 8.8um.
The basophil count ranged between 1 to 20% with a mean of 10%. The basophil size ranged between 10.4 to 16.4 um with a mean of 12.9 um.
The eosinophil count ranged between 4 to 11% with a mean of 7%. The cell size range between 12.0 to 20.4um with a mean of 15.7um. The eosinophil count decreased with increase in carapace length.
The neutrophil count ranged between 1 to 14% with a mean of 7% and the cell size ranged between 9.8 to 20.0 um with a mean of 14.6um. The neutrophil count increased with an increase in carapace length.
The thrombocyte count ranged between 20 to 70% with a mean of 46%. The T-lymphocyte percentage ranged between 58 to 80% with a mean of 68%. The T-lymphocytes with more than 3 SRBC constituted only about 20 to 25%.
Trace metal concentration studies were carried out in serum, brain, spleen, kidney, heart and liver and the various concentrations of iron, zinc, manganese and copper were recorded. The result indicates that iron content is more in all the tissues when compared tin zinc, manganese and copper. However there is no significant relationship between other trace metals in the tissues.
Serum protein separation showed only r B and albumin fraction whereas the human serum protein showed r,B,L2,L1 and albumin fractions.
Histology
While patrolling the area for sea turtle nesting season on the east coast of India near Tuticorin (Latitude 8o50´ N, Longitude 78o8´ E) an illegal pouching was found and the fisherman took the animal and slaughtered for their benefits. During that time the various internal organs and tissues like ovary, heart, lung, spleen, brain, stomach, intestine, kidney and skin were taken from the sea turtle Lepidochelys olivacae and on the sport the tissues were preserved in 10 per cent buffered formalin and brought to the laboratory and used for histological studies.
For histological studies the different organ tissues were taken in separate containers. The tissues were transferred to 70 per cent alcohol for 24 hours. The different tissues were treated with 90 per cent alcohol for 24 hours. Then the tissues were passed through 100 per cent alcohol for 6 hours and xylene till these tissues became transparent . The tissues were embedded in paraffin wax. Thus the blocks were made by using ´L´ molds.
The sections were taken at 5 u byy using microtome and placed in clean dry glass slide which was already coated with an adhensive (50 per cent glycerin and 50 per cent albumin)mixture and spread over the slide. The sections were kept in the oven 30oC to 40oC for 24 hours. And deparaffinised by the xylol and hydrated in alcohol series 100 per cent, 90 per cent, 70 per cent, 50 per cent, 30 per cent , and kept in water for few minutes. Then the slides were transferred to iron alum mordant aand stained in Heiden harry´s haematoxylin. Then the slides were kept in running water both for 10 minutes for removing excess of stain and dehydrated in alcohol series 30 per cent, 50 per cent, 70 per cent and stained in alcoholic Eosin and kept in 90 per cent. 100 per cent alcohol and cleaned in xylol. Then the sections were mounted in DPX mountant.
The slides were examined under the microscope and the structure of different tissues were described. Then the microphotographs from the prepared slides were taken. The histology of various tissues are described.
The histology of different organs of the sea turtle Lepidochelys olivacea was studied.
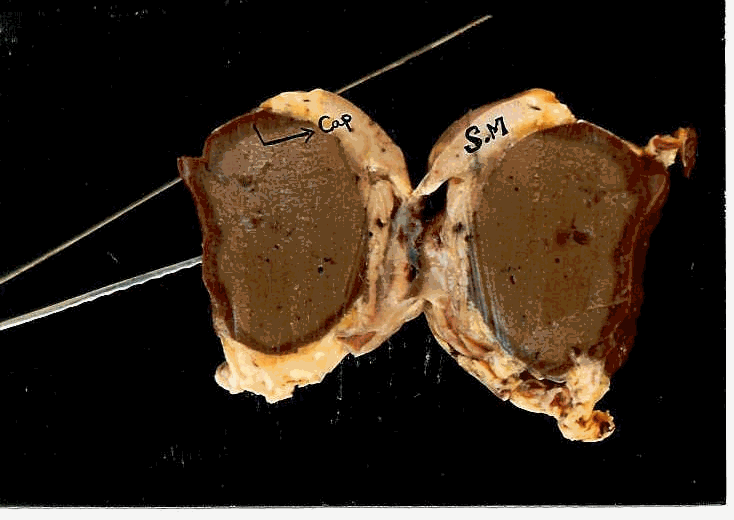
The spleen tissue shows two distinguishable regions, namely white pulp and red ; the former being composed of lymphocytes and the latter with venous sinusoids, nucleated RBCs., lymphocytes, plasma cells neutrophils and histocytes.
The liver tissue shows central vein, portal triad and hepatocytes. The liver cells are polygonal with vacuolated cytoplasm and contains centrally or eccentrically placed round uniform nuclei.
The aorta section shows an irregularly shaped lamina lined by flattened endothelium. In the bluish myxoid matrix stellate and spindle shaped cells are seen . The peripheral layer shows blood vessels and nerve bundles.
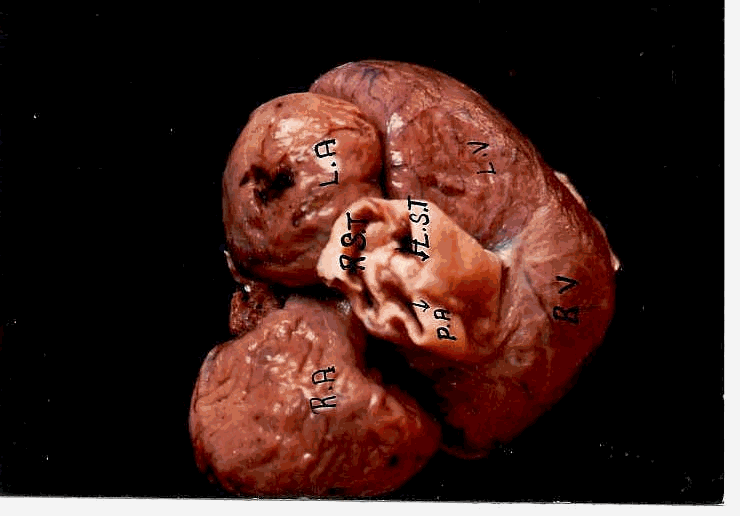
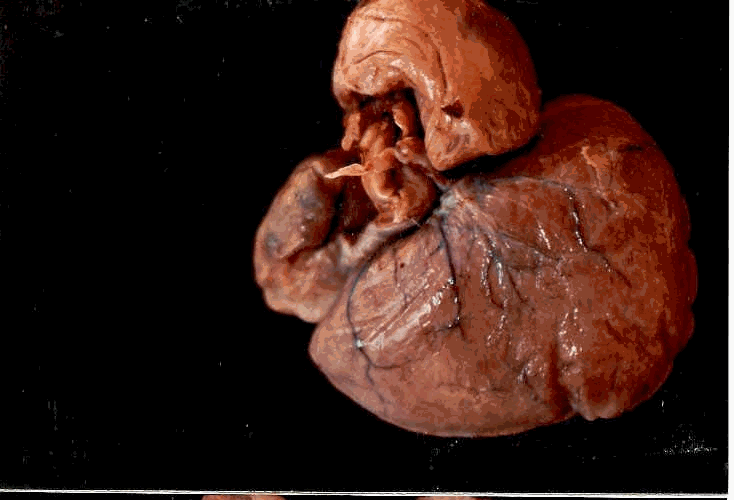
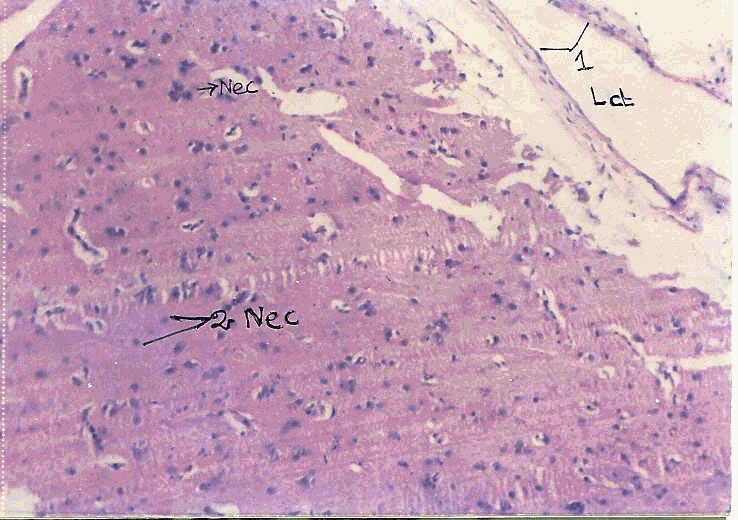
In heart the endocardium shows a thin layer of flattened cells and the myocardium is composed of muscle fibres. The epicardium shows no fatty tissue.
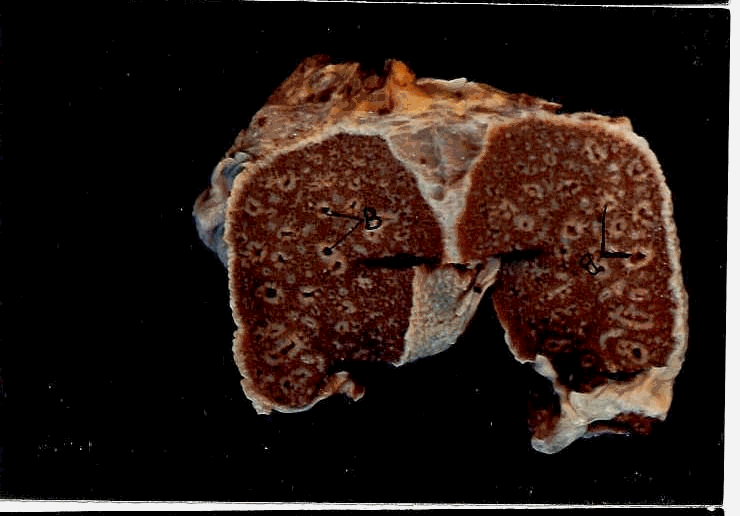
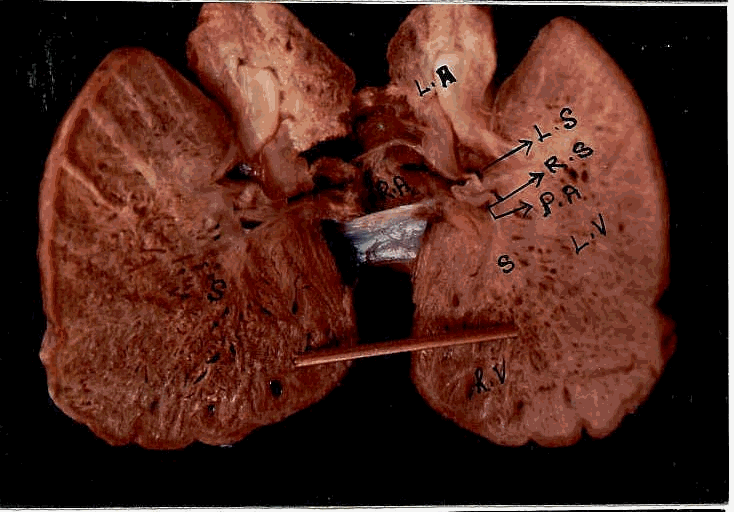
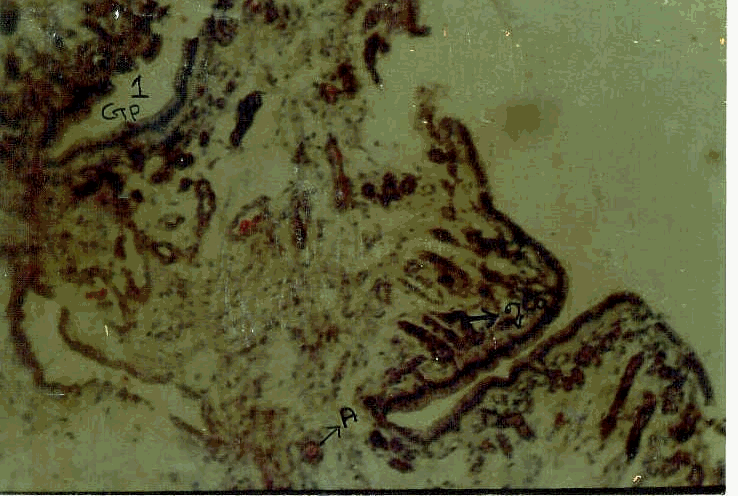
Lung section shows bronchi and respiratory bronochiolar like structures. One or two foci of lymphoid collections are seen in the peribronchial area. In addition, blood vessels, lymphatics and nerve bundles are also seen within the septae. Brain tissue is composed of neurons, glial cells and microglia.
Section of stomach shows the following layers, layer of mucosa, submucosa, muscular layer and serosa.
The intestine section show the following layers, lucosa, muscularis mucosa, sub-mucosal layer, muscle layer and serosa.
Skin section shows a thin epidermal layer composed of 7 to 10 Lyers of cells. Granular cell layer is composed of the prickle cells with abundant eosinophilic cytoplasm. The overlying epidermal layer is highly keratinised and the sub epidermal layers shows thick and thin fibro-collagenous connective tissues with scattered blood vessels.
Section of kidney shows the cortex and medulla. Glomeruli and tubules are seen in the cortex. The medullary cord composed primarily of collection ducts coursing across the cortical layer. Transititional epithelium is not seen in the pelvis.
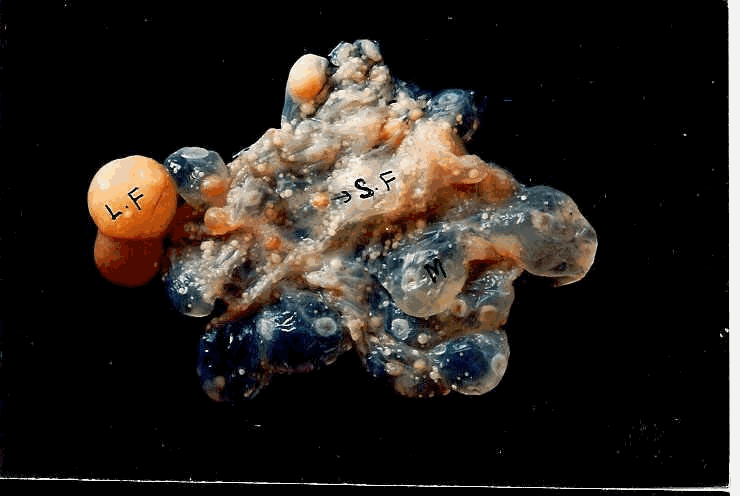
Section of ovary shows white discold structure resembling
corpora lutea, with a central cavity containing disorganized and degenerating cells enclosed by a compact, well organized fibrous tissue. In the ovary of reproductively inactive animals a narrow compact cortex and spongy medulla are readily recognized. Small ovarian follicles consist of an oocyte surrounded by a single layer of two cuboidal cells embedded in a mass of large vacuolated cells. In some follicles approaching maturation the follicular wall is drastically reduced and appears to consist of a regular fibrous outer layer. The internal layer is a monolayer with flattened vacuolated cells separated from the yolk by a thin homogenous layer. This is probably the basal lamina.
Although some information is available on various aspects of haematological parameters of turtles, there is no such study on the haematology of olive ridley frequenting the Indian coasts.
The present study is an attempt to investigate the haematological parameters of serological and immunological aspects, which will aid in turtle aquaculture and hybridization experiment. Many authors investigated the taxonimical and ageing relations of various turtles by serological and immunological tests. Besides the serum protein study will help to understand protein pattern of the turtle Lepidochelys olivacea and the immunological study will be helpful to understand the immunoglobulin levels in turtle blood serum and it is believed such study would help to relate the evolutionary relations among turtles species.
In this pilot study the serum of turtle was biochemically and immunologically tested to findout the presence of different proteins and immunoglobins in it. The turtle´s serum was compared with human serum.
Electrophoretics method was used to separata the serum proteins. The serum of turtle showed (Fig.23) B,L2,L1, and albumin fractions whereas the human serum showed r,B,L2,l1, and albumin fractions. The r globulin band was not found in the turtle´s serum. A reverse band from the origin of the sample applied point shows the r globulin region. This r globulin region was absent in the turtle´s serum. This absence was further confirmed by electrophoretic method using agarose gel and by immunodiffusion, single radial immunodiffussion technique was followed for qualitative test immunodiffussion technique.
All antibody molecules are r globulins, but not all serum globulins are antibodies. By electrophoretic separation of serum proteins, immunoglobulins mm are localized in the r globulin and occasionally in the B globulin regions, diagramed in figure. The antibody portions of the serum globulins are refered to as immunoglobulins ( Bigley et al., 1975)
Antibodies are immuoglobins that can react specifically with the antigen that stimulated their production immunoglobulins comprise about 20 per cent of total serum proteins, and a variable proportion of immunoglobulins have antibody acticity. Antibodies may be characteerised by their chemical, physical, and immunologic properties. Among the prominent physicochemical properties used for classifying antibodies are solubility in salts and solvents, electrophoretic mobility, molecular size and sedimentation in the in he ulra centrifuge. Electrophoretically most antibodies move with the r and B2 fractions and a few with L globulins (Jawetz et al., 1987).
The qualitative test for immunoglobulin level was done by immunodiffusion technique. In this method both human serum and Turtle serum were tested comparatively with Goat antisera IgG, IgM and IgA. Human serum test showed protein precipitate line or mark but the turtle serum did not show any line or mark (Figure 24). The result confirmed that there was no immunoglobulin in the turtle serum. Immunoelectrophoresis method was also done to confirm whether the immunoglobulin is present or not in the turtle serum. In this method the human serum showed the protein precipitate are but it was absent in the turtle serum (Figure 25).
Quantitative test for immunoglobulin level was done by single radial immunoelectrophoresis (Mancini et al., 1965). From this study the human serum showed protein precipitate ring in all IgM, IgG and IgA anti sera but the turtle serum did not show any protein precipitate ring in the concerned anti sera (Fig.26). The above results lead to conclude that there is no immunoglobulins in the serum protein of turles because of the absence of r globulin in the serum protein. The phylogency of immunoglobulins showed a pentameric macroglobulin similar to the IgM class of mammals has been found in Amphibia, Reptilia and Aves. A Hexameric form of immunoglobulin is found in the clawed toad amphibian. The chicken has a low-molecular weight immunoglobulin that is distinct from any immunoglobulin described in mammals. Lungfish also contain low; molecular weight immunoglobulins having 5S or 6S. Human immunoglobulin is a 7S molecule. The results described by Bigley et al (1975) showed low molecular weight immunoglobulins in other vertebrates and Lungfishes. However there was no immunoglobulins in the heavy chain tree. This result confirmed that there is no immunoglobulin level in the turtle serum.
As this is a pilot study, further study subjecting the turtle serum for the electrophoretic test, the turtles blood for B-cell, the different tissues for the presents of immunoglobulins and the complement fixation test will prove the exact presence or absence of the immunoglobulin in turtle.
The reason for the absence which would be related to the immune response in turtle opens new vista for research.
List of Figures
Structure of the ovary of sea turtle Lepidochelys Olivacea
L.S. of the lung
Dorsal view of the heart
Ventral view of the heart
L.S.of the heart
C.S. of the spleen
Structure of the spleenic tissue (L.P)
Structure of the spleenic tissue (H.P)
Structure of the liver tissue (L.P)
Structure of the liver tissue (H.P)
Structure of the Aorta tissue
Structure of the heart tissue
Structure of the lung tissue
Structure of the brain tissue
Structure of the stomach tissue
Structure of the intestine tissue
Structure of the skin tissue
Structure of the Kidney cortex (L.P)
Structure of the Kidney cortex (H.P)
Structure of the Kidney medulla
Copyright 2005 @ wasterecycleinfo.com A StudioFx creation